Plotting robot paths
Plotting on an image
Basically you obtain an image. Apply the image as a background of your application. Then set you origin and scale factor so that your units (inches in my case) match the units of the image. Then you can plot anything you want over the top.
I present a method to set the scaling graphically. You point and click. Otherwise you can do the same calculations manually and enter the values into your code. The manulal method is probably best if you are only going to do one image. But I like to experiment with the same image at different zoom levels. And I also run my robot at various locations. So I use the graphical method so I can quickly generate a new image and set the required values.
I use Visual Basic 6.0 to create my applications. It has controls that help us do what is needed. But the basic concepts of scaling and plotting are valid no matter what language you use.
Getting an image
http://www.teamhassenplug.org/robots/GreenMonster/ChibotsJ08/
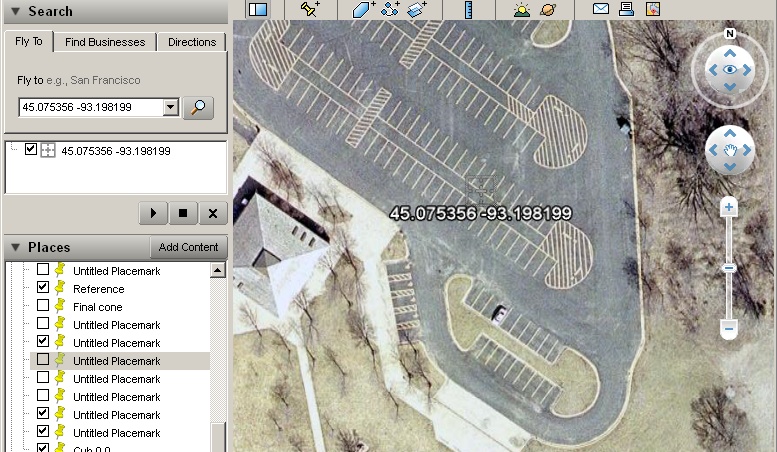
Here is the starting location of the Spring 2008 ChiBots Robomagellan competition. (41.694041 -87.836359) You can type these values into the search box in Google Earth and it will "Fly" to that location as shown below.
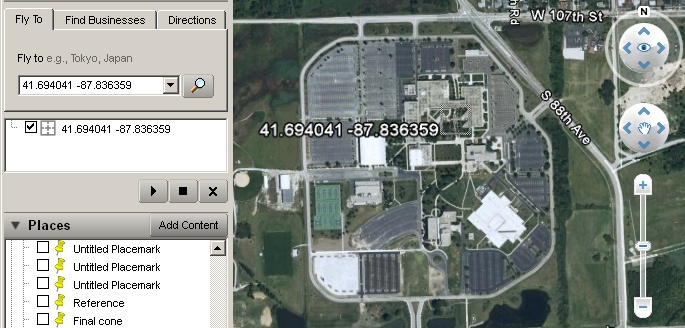
Moraine Valley Community College
Then we can use the controls to zoom and pan to see what we want.
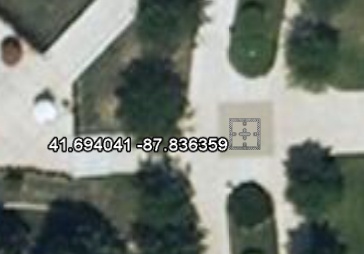
Robomagellan starting point
Crop the image to what you actually want and then save it to a disk file. I save my images as .JPG but you can save it to whatever format your application will accept. Sometimes jpeg compression will degrade your image. So you may want to try a lossless format.
If you want a large image then you can capture multiple images (or tiles) and paste them into a larger image in your graphics editing program. (Just don't change the zoom level while you are getting the multiple images.) Then if the application you write can support image scrolling then you can scroll to the point you want to see.
Another thing to keep in mind is that you can create two (or more) images at different zoom levels. You can have one that covers the entire area of interest that fits your application viewport. Then have another larger image that repesents the zoomed view. But your application has to be smart enough to switch the scale factor as you switch images.
Identifing significant points
These push-pins are important because they do two things for us. First they give us a marker that we will use later as visual reference points. Second they give us locations in the real world. In my case I used the latitude and longitude values from Google Earth and I typed those into my program to identify those points. As we will see later we can use distances instead of latitude and longitude.
Actually your captured image doesn't require push-pin markers. But you need to select a point that will be visible in the final view so you can click on it. You can pick something like the intersection of two sidewalks. Or a light pole. Or the corner of a building. You need to identify that point in the source program (in this case Google Earth) so I use a push-pin. After you record the location then you can delete the push-pin.
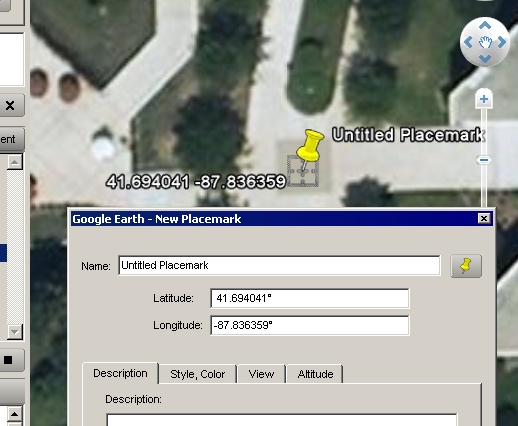
A push-pin and corresponding coordinates
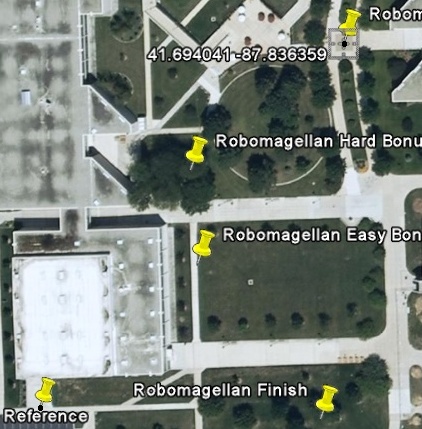
Here is an image where I have placed "push-pins" at strategic locations.
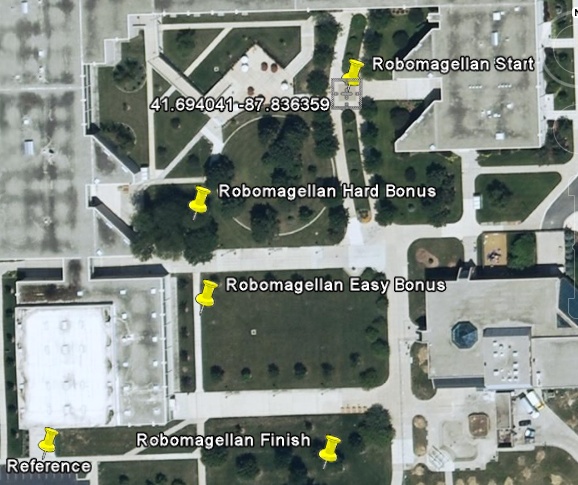
Strategic locations
Creating an application
I could (and may in the future) explain all the little steps to go from a simple static display to a scrollable display, but for now I will just build the final scrollable version.
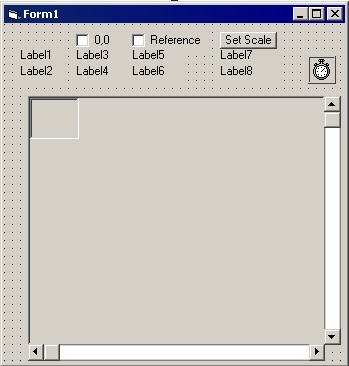
I start VB 6 and create a new project. Place a rather large Picture Box control on your form. This will be your view port. Then place another Picture Box control inside of the first one. Put it in the upper left hand corner. So it will look like this:
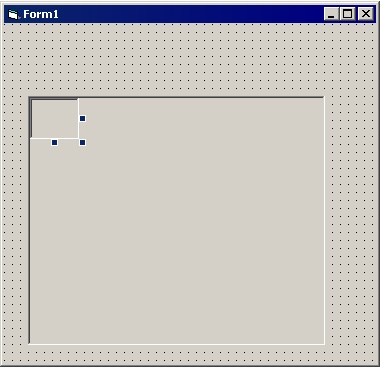
Initial picture boxes on form
And set the AutoSize property of Picturebox2 to True. This allows the Picture Box to take on the size of your image. Also set AutoRedraw to True. Otherwise the new data you draw will be erased as you scroll around.:
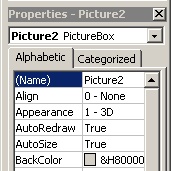
Set AutoSize and AutoRedraw
Add this code to the Form Initialize (I put stuff in Form Initialize instead of Form Load because Form Load doesn't always work.Something about some things not being initialized at that time.):
(I'll have to figure out how to format this code in HTML later)
Private Sub Form_Initialize()
Picture2.Picture = LoadPicture(App.Path + "\plot4.jpg")
End Sub
It should now look like this when we run it:
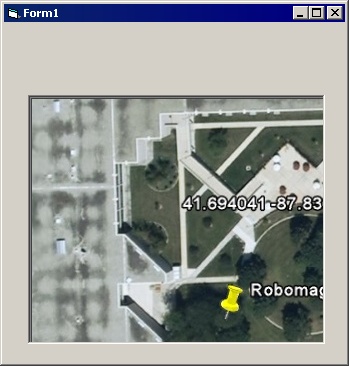
Our first image
Now add scroll bars on the right and bottom. Add a timer and set its interval to 100 (ms). Add the following code:
Private Sub Timer1_Timer()
Dim hs As Integer
Dim vs As Integer
hs = HScroll1.Value
vs = VScroll1.Value
Picture2.Left = -hs
Picture2.Top = -vs
End Sub
Now when you run the program the image should scroll around when you use the sliders.
Now for the important part. How do we scale this image to the real world? We can add two labels and add the following code to view the cursor coordinates when the mouse is over our image:
Private Sub Picture2_MouseMove(Button As Integer, Shift As Integer, X As Single, Y As Single)
Label1.Caption = X
Label2.Caption = Y
End Sub
Now as we move the mouse around you will see the labels change as we move over the image (which is actually imagebox2). The labels don't change if the mouse is not over the image. Most importantly you will notice that if we scroll the image from its home location that the coordinates that the labels show are still correct. Hence we have a scrollable image and we can read the screen coordinate system. You will also notice 0,0 is in the upper left, which is Microsoft thing.
If we don't change anything then the coordinates are in "twips". http://en.wikipedia.org/wiki/Twips You can change the property to pixels if you would prefer that.
Now I will add two more labels that I will use to display the reference coordinates. Label 3 and 4 will capture the screen values for my 0,0 reference point. Label 5 and 6 will capture the screen values for my "other" reference point. We want a point we will use for our 0,0 location and an arbitrary point in an opposite corner of the image. So in our sample image I have a push-pin labeled "Start" and another labeled "Reference". The Reference push-pin is stuck in a spot where I could see an object on the ground. So I should be able to walk to that location and see the object.
In order to signal when to capture screen coordinates I use two checkboxes. One checkbox for the 0,0 and another for the reference point. So my screen now looks like this:
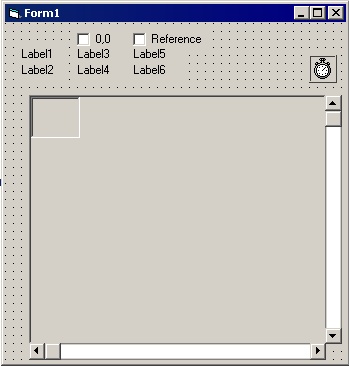
Reference point checkboxes
And we will add the following code:
Private Sub Picture2_MouseDown(Button As Integer, Shift As Integer, X As Single, Y As Single)
If Check1.Value = 1 Then
Label3.Caption = X
Label4.Caption = Y
Check1.Value = 0 ' Turn it off
End If
If Check2.Value = 1 Then
Label5.Caption = X
Label6.Caption = Y
Check2.Value = 0 ' Turn it off
End If
End Sub
So now when we run the program we can capture two points. We can scroll over until we see the 0,0 reference push-pin. Then set the 0,0 check box. Then click on the push-pin (right on the tip of the pin). This captures the screen coordinates. We can then do the same steps to get the Reference push-pin coordinates.
By subtracting the x value of the 0,0 push-pin from the x value of the Reference push-pin we get a delta-x distance in twips. Likewise we can do that same for the y values.
So at this point I will add "Set Scale" button. It will subtract the values as mentioned above and put the results into labels 7 and 8. (Notice I cheated and let VB do all the conversion as I subtract text fields. :-)
Added a Set Scale button
The following code will do this:
Private Sub Command1_Click()
Label7.Caption = Label5.Caption - Label3.Caption
Label8.Caption = Label6.Caption - Label4.Caption
End Sub
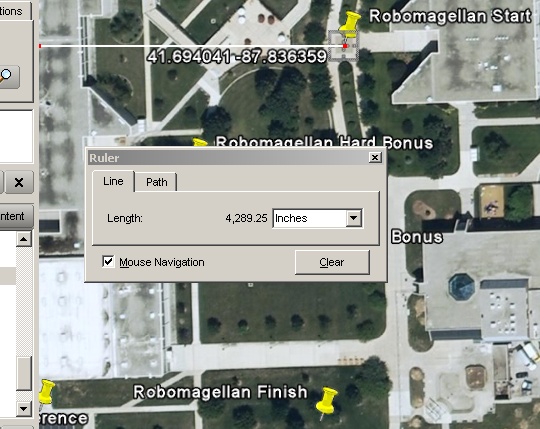
As I mentioned earlier I use the latitude and longitude values from Google Earth. Lets look at just using measurements from Google Earth. Using the ruler function in Google Earth I can measure a distance in various units. So I chose to use inches. It is easy to measure a diagonal from start to end. But I need the x distance and the y distance. So I slid the image to the left so the "Reference point is against the edge. Now I can use the ruler to measure from the "Start" point to the left edge, like this:
Added a Set Scale button
and do the same thing with the vertical, like this:
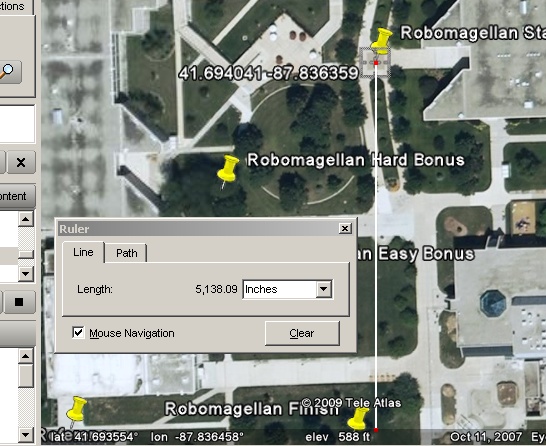
Added a Set Scale button
So if we add a mechanism to get these numbers into our display program then we are ready to scale to the real world. I will add two text boxes where I can type in the numbers. Then add code to do the scaling. Our final scale will be in labels 9 and 10.
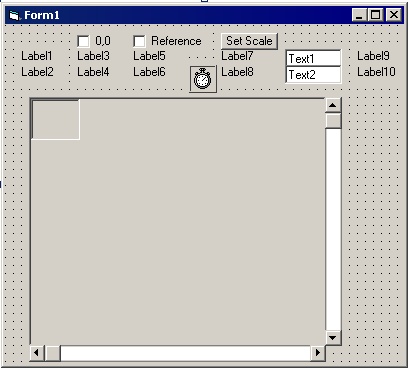
All the numbers
I modified the Set Scale code to look like this:
Private Sub Command1_Click()
Label7.Caption = Label5.Caption - Label3.Caption
Label8.Caption = Label6.Caption - Label4.Caption
Label9.Caption = Val(Text1.Text) / Abs(Label7)
Label10.Caption = Val(Text2.Text) / Abs(Label8)
End Sub
Now if I run the program and type in the Google measurements, then set my two screen locations, then click the Set Scale button I get:
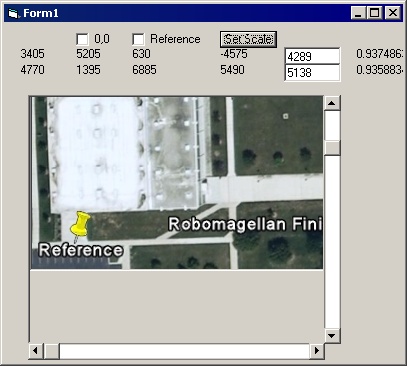
The final scale numbers
So it thinks the x scale is 0.937486 and it thinks the y scale is 0.935883. They are almost the same. And they should be since our coordinate system should be square. I normally work with bigger images and I was in a hurry when I was clicking points. So these values can now be used to plot points on our image. Our coordinates to plot will be in inches and we will multiply that number by our scale factor to convert directly to screen coordinates. (Or maybe we divide by the scale, I may have something backwards.)
Something to note is that out 0,0 point really is 0,0. Also remember that Microsoft's coordinate system is upside down so we have to flip the vertical axis when we plot our x,y points.
Testing and plotting
I added these lines to the end of Set_scale:
Call plot_point(0, 0)
Call plot_point(Val(Text1.Text), Val(Text2.Text))
Then I created this routine to plot points with our new scale:
Private Sub plot_point(x As Integer, y As Integer)
scaled_x = Label3 - (x / Label9)
scaled_y = Label4 + (y / Label10)
Picture2.PSet (scaled_x, scaled_y)
End Sub
The dots are in the right places
The project up to this point
http://www.sampson-jeff.com/plotting/plotting.zip
Whoops
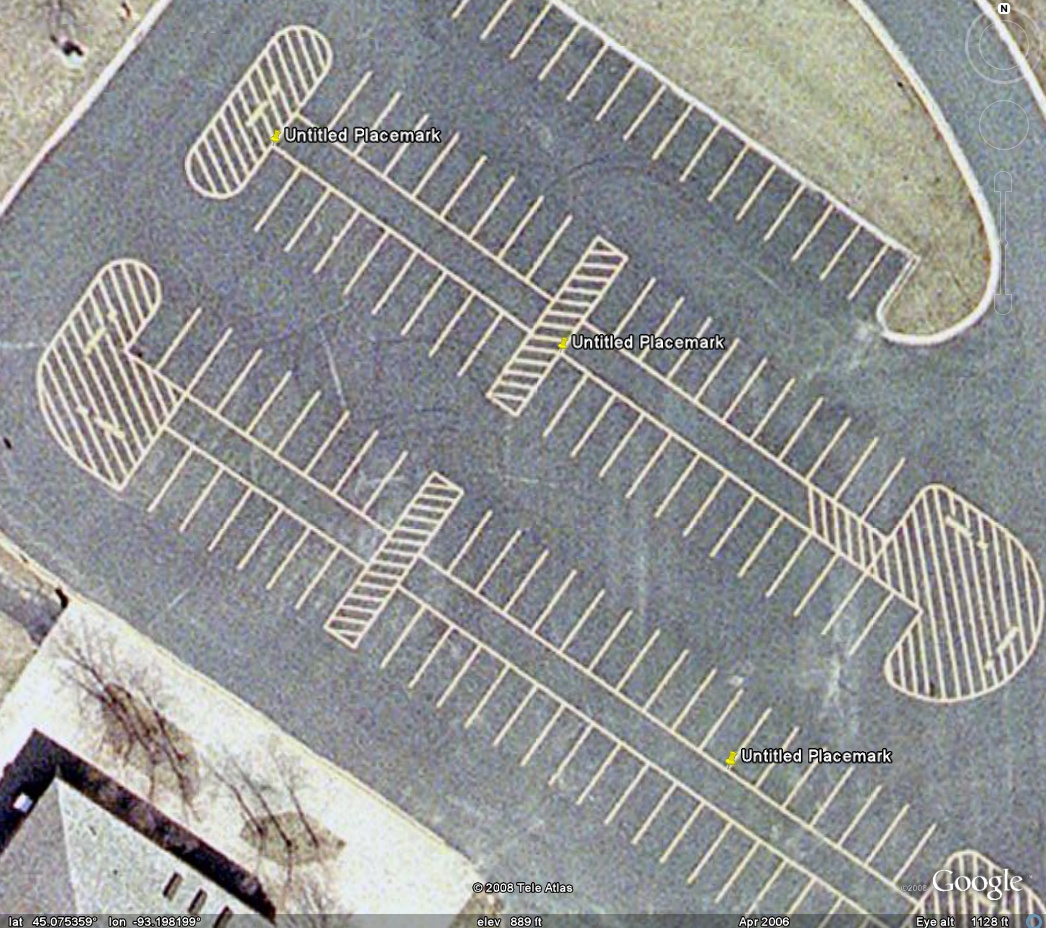
A park by me
This is the actual file that I use for the parking lot.
http://www.sampson-jeff.com/plotting/park1.jpg
I measured the X and Y delta distance like I did before.
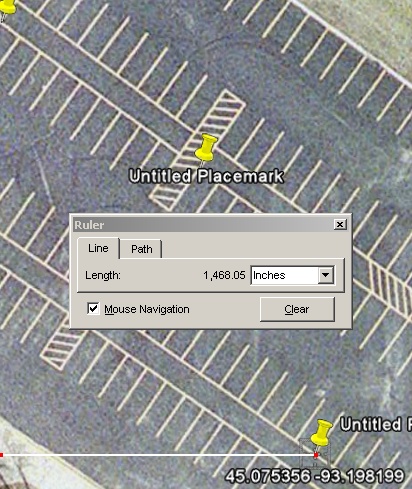
x delta for park1.jpg
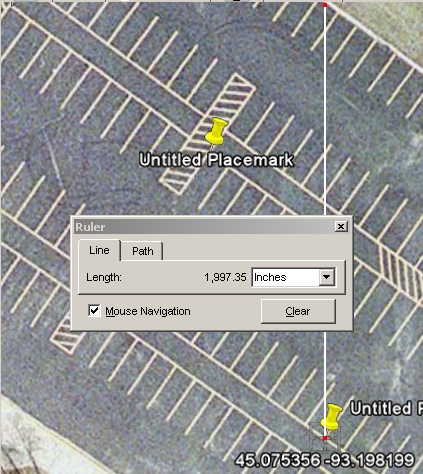
y delta for park1.jpg
I modified the original program so that I just type in the various numbers that I need. Then I added code to open the log file and plot some data. It is actually a trimmed down version of my big robot plot program. It appears to have some extraneous parsing left over that I did not use and did not delete.
Here is the result of plotting one of my log files to an image of the park.
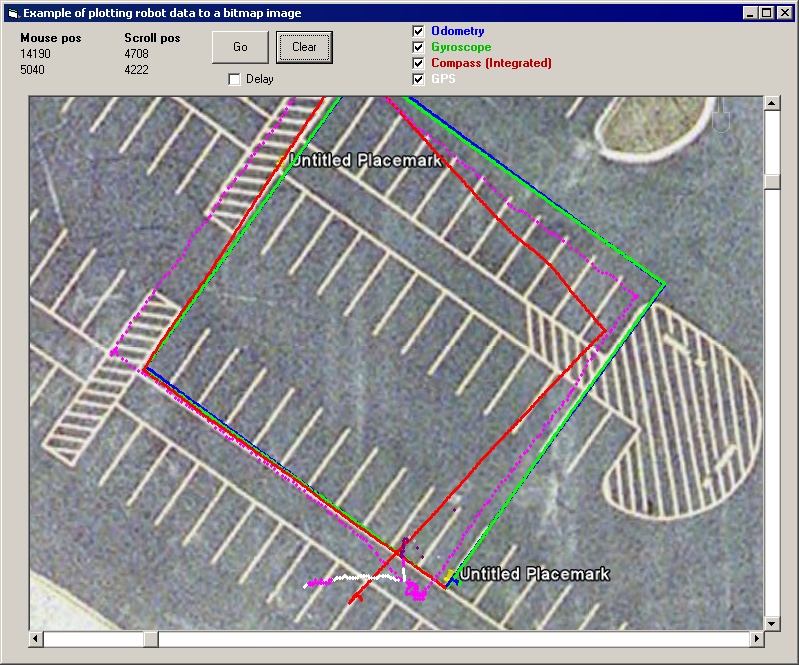
Log file plot
The second project
http://www.sampson-jeff.com/plotting/plotting2.zip
Reference
http://www.sampson-jeff.com/eep/eep15.htm
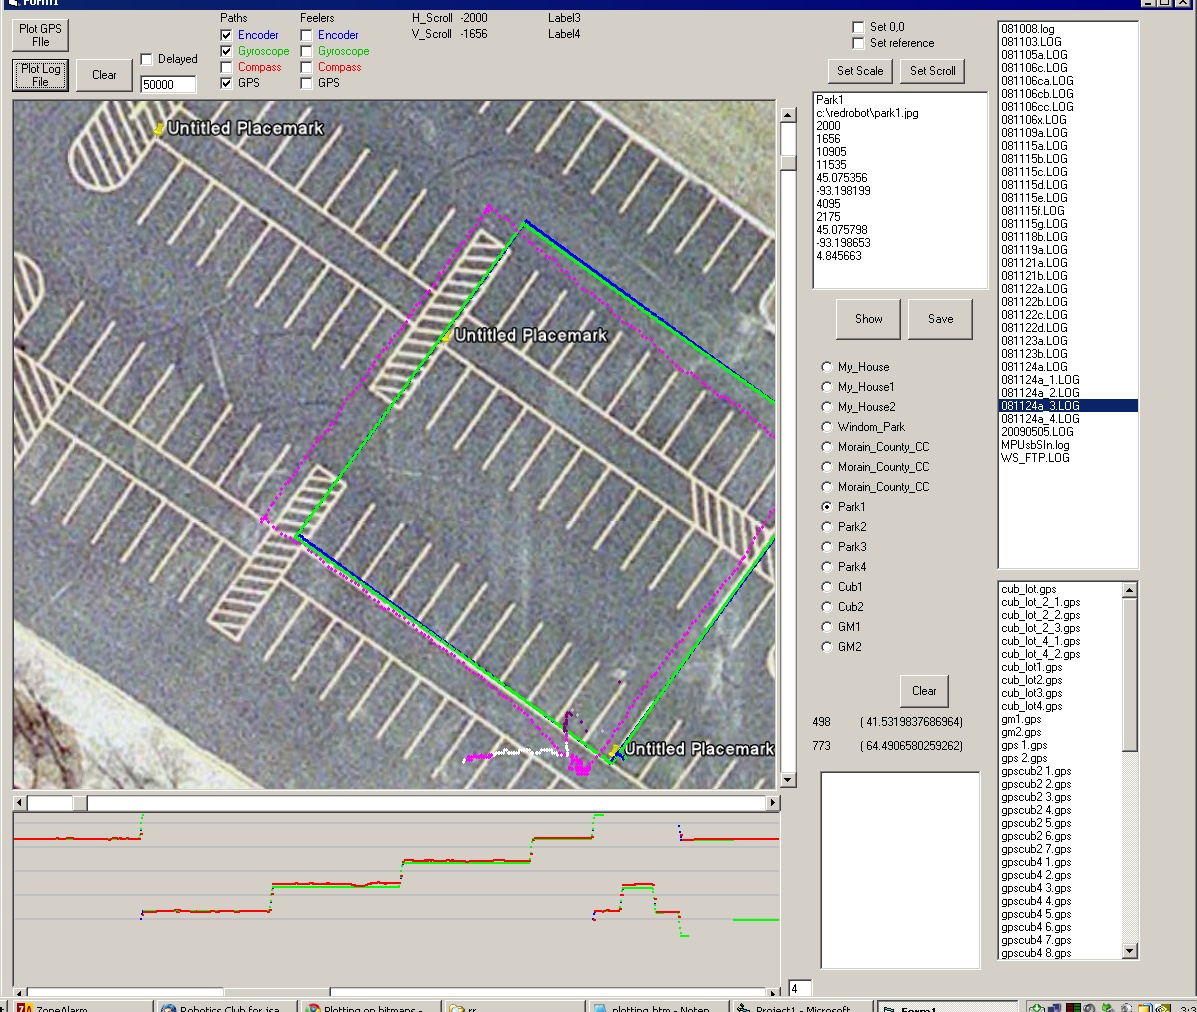
This link shows a screen dump of my big application.
http://www.sampson-jeff.com/plotting/plot_app.jpg
It is displaying the same log file that we used above. This application lets me click a geographic selection and it automatcally displays the image, sets the scale and it sets the preferred scroll location. Then I can click on one of the file list boxes and select either a log file or a GPS file. The box at the bottom of the screen is a plot of compass (red), odometry (blue) and gyroscope (green).
I added another feature that lets me select a point by clicking on the screen. I can use this to create a list of points that the robot can use as a path. So in the case of Robomagellan I can click a series of locations and lead the robot around known objects.
Visit Twin Cities Robotics Group
Back to my Home Page http://www.pobox.com/~jsampson
This page is currently maintained by Jeff Sampson